

API Analysis Highlights: February
- GOV.UK in the UK Government category takes the overall top spot for the public sector again with a CASC score of 9.85, up from 9.77 in January.
- Department of Justice in the U.S. Government category takes the overall title for the public sector again with a median latency of 46 ms, down from 47 ms last month.
- Virgin Money in the Open Banking – UK – Production category takes the overall wooden spoon this week with a CASC score of 4.97.
- thevirustracker.com in the Covid-19 category takes the overall wooden spoon this month with a CASC score of 2.31.
- We look at the Social Networks category and the importance of ensuring that your APIs are fully performant for all users in all clouds in all regions.
Something of interest
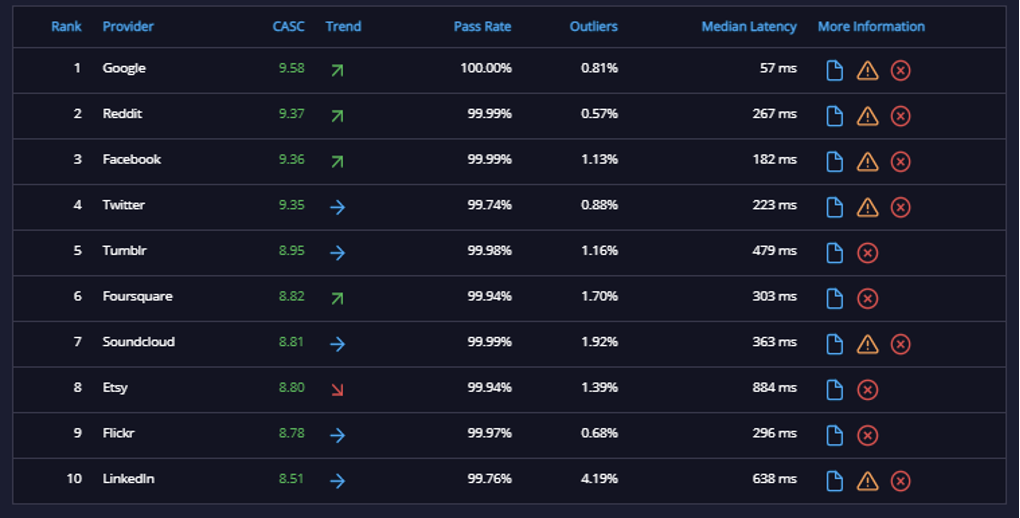
The Social Networks category is a competitive one in our API analysis. All APIs are well in the Green Zone and 4 out of the 10 have a CASC score of over 9.00. LinkedIn props up the table, but it is still has a fairly respectable CASC score of 8.51. But as ever there is room for improvement.
LinkedIn is fastest for Azure in North America, which makes sense. It is much slower in all other regions, but particularly South Asia. Given LinkedIn’s user base, this seems a non-ideal situation. But Azure is only the fastest cloud in two out of the six regions.

The rate determining step is Handshake Time. This is fast in North America, but much slower elsewhere (Process Time is also quite slow). This is why you need to monitor your APIs actively. Yiu need to see where your APIs are performant and where they are not. You cannot assume that your users are all in one region or using one cloud. LinkedIn needs to look into how to optimize Handshake Time for all regions outside North America.

Etsy is fast from Azure Europe and Azure North America, but pretty slow from all other locations. This suggests an API highly optimized for users from one cloud in two regions.

The rate-determining step is Process Time, but interestingly the fastest location is IBM Cloud in North America, although Azure is almost as fast and AWS and Google in North America are 700 ms slower. Even if you are focused on users in a couple of regions, you can’t assume that all users will necessarily access your service from the same cloud. To provide the optimal service, you need to actively monitor your API to understand the experience all of your users are experiencing regardless of the cloud location.

API Analysis: Tops in Overall Quality
February 2021
|
Category |
Organization |
CASC score
|
|
Corporate
|
GitHub |
9.62 |
|
COVID-19 |
ubentos.com |
9.56 |
|
Search
|
|
9.31 |
|
Social Networks
|
|
9.58 |
|
UK Government
|
GOV.UK |
9.85 |
|
US Government
|
Department of Justice |
9.70 |
|
Messaging APIs
|
Zoom |
8.91 |
API Analysis: Top Performers by Latency
February 2021
|
Category |
Organization |
Median Latency
|
|
Corporate Infrastructure
|
Microsoft Office |
221 ms |
|
COVID-19 |
WHO |
90 ms |
|
Search
|
|
403 ms |
|
Social Networks
|
|
57 ms |
|
UK Government
|
Police.UK |
82 ms |
|
US Government
|
Department of Justice |
46 ms |
|
Messaging APIs
|
Slack |
268 ms |
API Analysis: Worst Quality
February 2021
|
Category |
Organization |
CASC score
|
|
Corporate Infrastructure
|
Microsoft Authentication
|
7.68 |
|
COVID-19 |
2.31 |
|
|
Search
|
Nobody under 8.00! |
|
|
Social Networks
|
Nobody under 8.00!
|
|
|
UK Government
|
NHS |
6.18 |
|
US Government
|
Environmental Systems Research Institute
|
6.49 |
|
Messaging
|
Nobody under 8.00!
|
Do more with API monitoring!
If you are new to APImetrics, sign up for a free trial so see how they could work for you with our free API set.
If you have any questions, please don't hesitate to reach out.