


After conducting the largest analysis of API performance ever undertaken, we've reached the same conclusion as we did when we first started with APIContext. Half of the APIs we survey STILL fall below expected quality standards. As Kin Lane, the API Evangelist says, "You wouldn’t operate an API without having the right data regarding it’s availability and stability—the same is true for the API industry, and the folks at APIContext have those numbers." In our original study, we were only able to focus on conventional error or success codes like HTTP 200. We didn't have the sophistication to understand more of the context of our findings. For example, we were able to see that over half of all the APIs we monitored had downtime during the week. But weren't able to conclude if that would impact users negatively. With our advanced monitoring tools like CASC , we can draw more detailed conclusions around the impact of API performance issues on users and providers. We still see that 50% of the APIs we monitor fail to meet our qualification for Good performance. That potentially leads to more than 200 wasted engineer-years of effort investigating unexpected performance problems. The Infographic we developed shows us a snapshot of the performance of the API calls we monitored over the course of 2016. In addition to seeing the performance problems, we were able to see regional and cloud-specific variations in API performance that should be considered when architecting an API- or Micro-service-based solution. 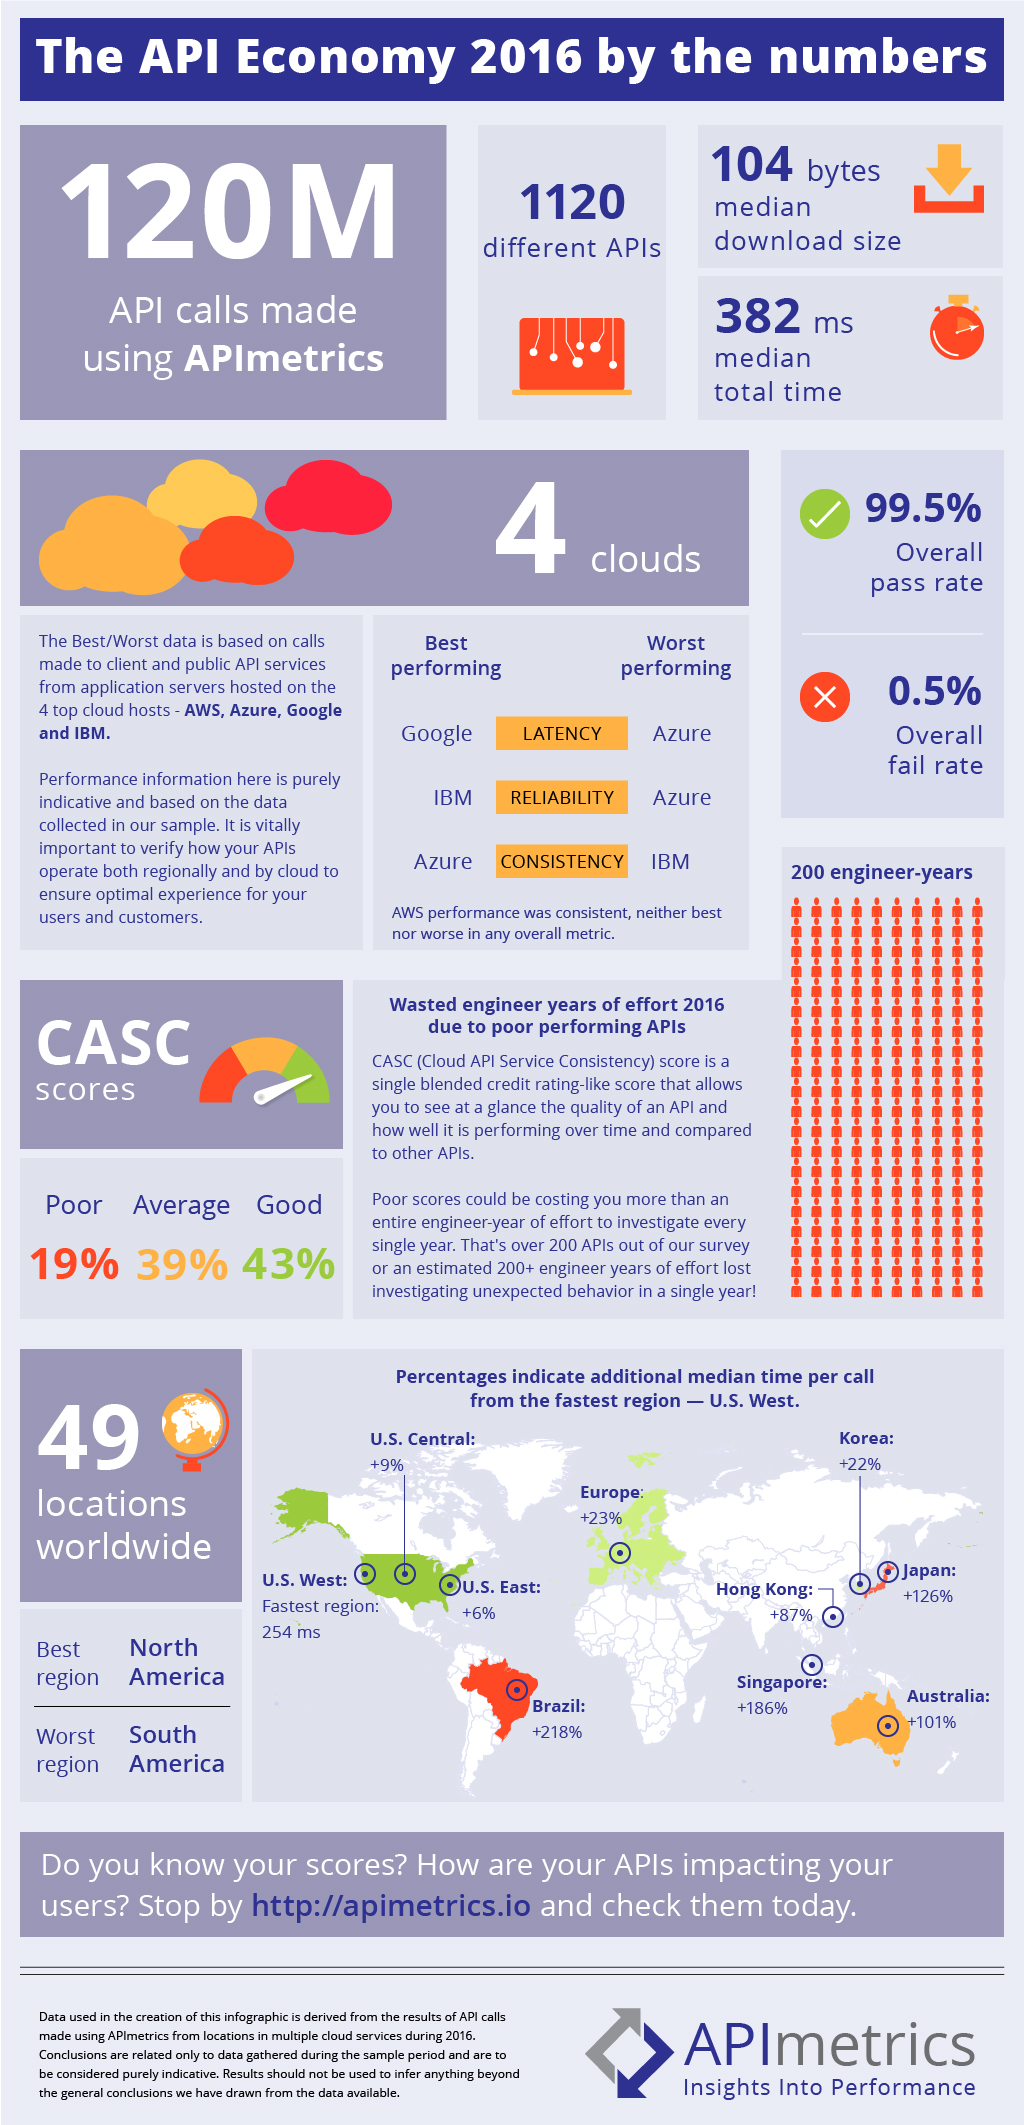

See what your APIs look like from the outside.
APIContext gives engineering, product, and customer success teams a shared view of API reliability, conformance, and customer impact.
Start free